Edward Leland

Data Scientist | GIS Specialist | Archaeologist
LinkedIn Profile
Datacamp Certifications/Projects
Selected Presentations
A Multi Machine Learning Model Study of Sampling Bias and Environmental Correlation
Project description: This study acts as the initial proof of concept and variable testing phase for archaeological predictive mapping in the Northern Iraqi section of Kurdistan. The method and results herein are part of a larger study hoping to characterize the geoscientific environmental variables in this area. As archaeological site location data is usually strongly sample biased, we needed to construct a series of test models to see if these biases matched strongly with any of our covariates. Additionally, this gave us the chance to see if the results of our models were consistent with previous publications. We noted various issues with the site locations and environmental covariates and will be addressing these by building a new database that will be outlined in the full publication later this year.
The Challenge of Sampling Bias
Archaeological data is typically biased due to uneven sampling. Researchers often collect data from more accessible or visually promising locations, leaving significant gaps. This study tests various predictive models to assess how well they manage these biases and how they correlate with environmental variables.
Models Tested
This study employs several statistical and machine learning models:
- Random Forest (RF): Programmed in R via the Biomod2 Library
- Gradient Boosting Machine (GBM): Programmed in R via the Biomod2 Library
- Maximum Entropy (MaxEnt): Created via the Maxent.jar GUI as it is written in pure Java and thus much faster over the large area and high number of covariates we used.
Among these, MaxEnt emerged as the most robust, particularly for archaeological data. It doesn’t require absence data, only presence data, and uses a background point approach to characterize environmental probabilities. This feature is crucial in archaeology, where it’s challenging to identify locations with no historical activity.
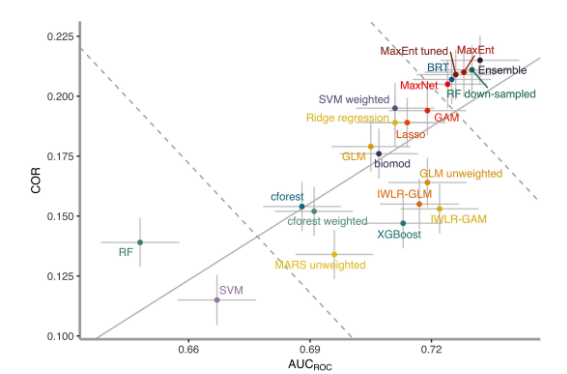
Additionally, Valavi et al. conducted an extensive evaluation of various species distribution modeling (SDM) algorithms, including machine learning and statistical methods. Their study assessed the performance of 20 different models, identifying Boosted Regression Trees (BRT), MaxEnt, a down-sampled Random Forest (RF), and ensemble models as the top performers. The research highlighted the strengths of MaxEnt for its conservative predictions, which is particularly useful in cases with presence-only data, like in archaeological site modeling. This evaluation serves as a benchmark for selecting appropriate models based on the specific requirements and data characteristics in SDM applications.
Environmental Covariates Used
Table 1: Description of Variables
| Variable | Description |
|---|---|
| Aspect | Orientation of Slope. Calculated from the Slope layer. |
| C_PREC_* | Sum of precipitation over one year for one of the four time periods. |
| C_TEMP_* | Average temperature over one year for one of the four time periods. |
| DEM_GLO_25 | 25m x 25m Digital Elevation Model (DEM). |
| Distance_to_road | Distance to an Assyrian road located in the area. |
| Distance_to_water | Distance to small drainage valleys in the area of interest. |
| Geohydrology | Qualitatively based map of the availability of water, determined by geology. |
| Geology | Geological map constructed by the Geological Survey of Iraq. |
| Geomorphology | Map of common geomorphological features, built from ground survey and remote sensing. |
| MRVBF | Multi-resolution valley bottom flatness, computed from DEM. |
| PREC_sum | Modern average precipitation over one year in the modern age (1972-2000, WorldClim data). |
| Sentinel2_NDVI_2021_MedianComposite | Normalized Difference Vegetation Index from Sentinel2 satellite data. |
| Sentinel2_NDWI_2021_MedianComposite | Normalized Difference Water Index from Sentinel2 satellite data. |
| Slope | Calculated from the DEM. |
| TEMP_AVG_average | Modern average temperature over one year in the modern age (1972-2000, WorldClim data). |
| TPI | Topographic Position Index, computed from the DEM, measuring elevation and slope. |
| TWI | Topographic Wetness Index, computed from the DEM, indicating potential for water accumulation. |
Note: Variables with an asterisk () denote bespoke calculations for each time period.*
Table 2: Description of Problematic Variables
| Variable | Description |
|---|---|
| Distance_cluster_* | Distance to location of sites for the time period indicated by *. |
| Distance_sites_* | Distance to location of sites for the age immediately preceding the indicated time period *. |
Our input data was divided into four time periods: Early (EB), Middle (MB), and Late Bronze Age (LB), as well as the Iron Age (IA). Site locations were created by overlaying a map of the polygonal shapes of each site over a raster grid of the study area. Next, we created a point layer with a point in each of the overlapped cells. In this way larger sites would be represented by a larger collection of presence points and have a larger impact on the model. 17 covariates were gathered or calculated. These are shown in Table 1.
Two additional layers were calculated for each time period but they were eventually left out of our final calculations. These are shown in Table 2. The reason for leaving these out were that we had intended to measure the effects of site locations from different times on whatever age’s model we were building. However, the Distance_cluster_* caused massive overfitting problems as it is a single layer cost distance model for site location. Any model attempting to predict site locations will eventually discover the utility such a layer and ignore all others. The Distance_sites_* layers had much the same issue, as site locations did not change by large enough margins to be appreciably different from 5 Distance_cluster_*. Once we determined the issues with these layers we decided to drop them from the final data set and only use the preceding 17 covariates. For all models we divided the data into 4 folds for validation tests. We also conducted variable importance tests to measure the relative importance of each covariate. To create absence data for the GBM and RF models, a random selection of points outside of the site locations were found. This selection was equal in size to the amount of presence locations for each age. The MaxEnt model had 20,000 random points selected, some of which could be the same as the presence locations, as MaxEnt attempts to build a probability density distribution of the general background environment.
Predictive Map Results
The predictive models constructed in the study—Generalized Boosting Model, Random Forest, and Maximum Entropy—yielded varied results in predicting archaeological site locations in Kurdistan. RF tended to overfit, focusing too narrowly on presence locations and thus limiting its broader applicability. Both MaxEnt and GBM showed a pattern of overemphasis on the “distance to water” covariate, highlighting the environmental feature’s influence but also suggesting potential overfitting and sampling bias. These outputs indicated that while the models could identify high-probability site areas, especially around known features like water sources, there is a need for further refinement to mitigate biases and improve generalizability.
The overreliance on the distance to water can be seen in the variable importance metrics for the different models:
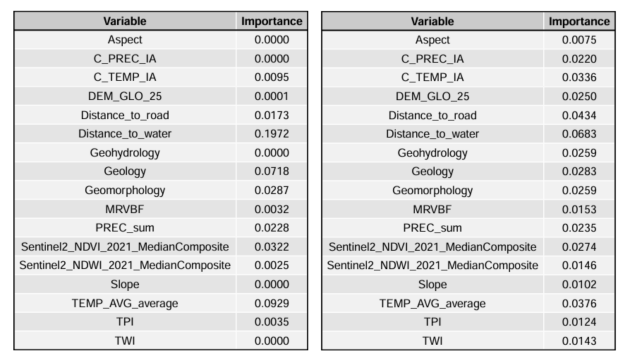 GBM and RF variable importance metrics for the IA model set. The results were consistent across each time period as can be seen in the predictive maps below.
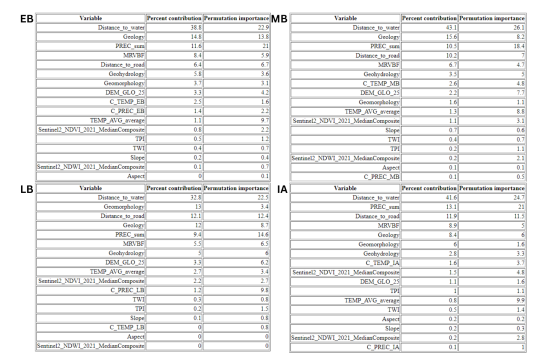 Maxent variable importance metrics for each time frame.
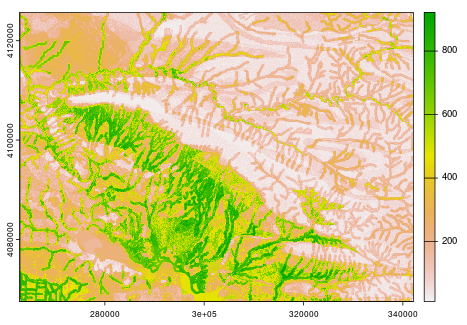
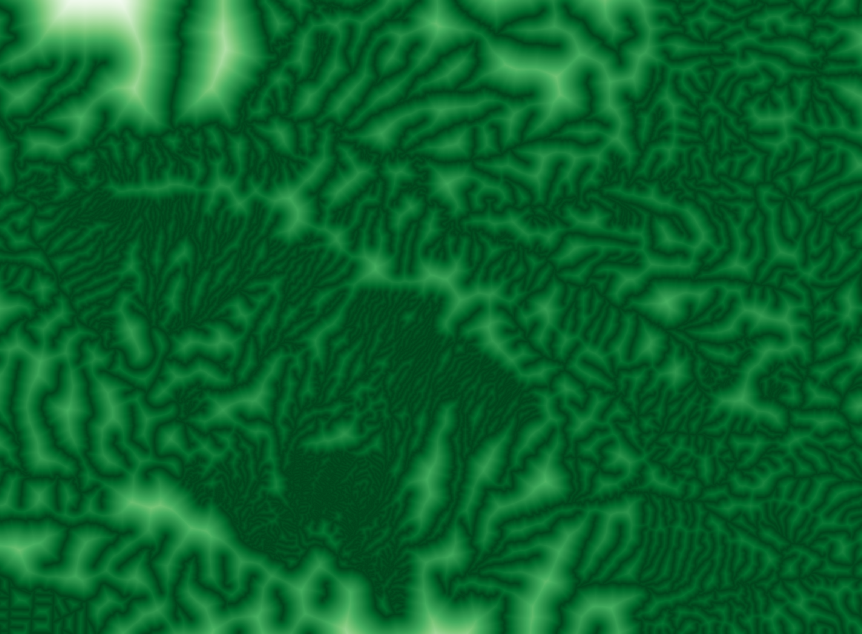
Distanct to water covariate visualized in isolation. The darker green an area is the closer it is geographically to a mapped drainage valley.
Below are the sresultant predictive maps. Note the similarity in output between the distance to water covariate and the final predictive map.
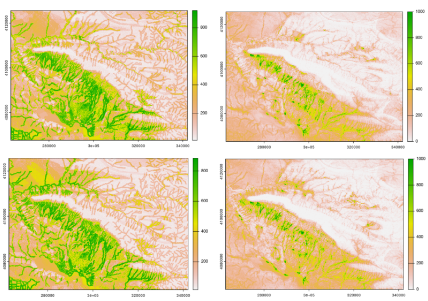
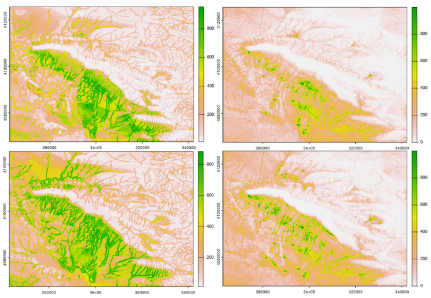
GBM (Left Column) and RF (Right Column) Predictive Maps in order from EB, MB, LB, IA. Color is correlated with probability green denotes approaching 100% and white means approaching 0%. The values of the color bar can be divided by 1000 to get a percentage.
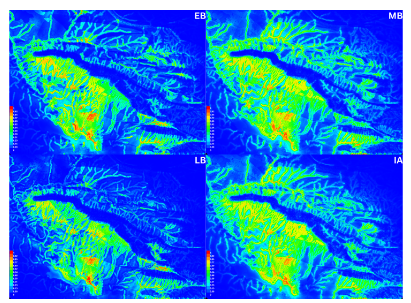
Predictive maps for MaxEnt. Red denotes approaching 100% probability and Blue means approaching 0% probability.
Explanation of Distance to Water Bias
The survey method used to locate sites in this region relied on archaeologists following the course of drainage valleys and noting any observed heritage resources. This approach contributed to sampling bias, as it skewed the data towards sites in proximity to water sources, in the case the drainage valleys themselves. As a result, the environmental covariates related to water proximity, such as “distance to water,” became overrepresented in the predictive models. This bias makes it challenging to distinguish whether the observed patterns are due to genuine archaeological factors or are artifacts of the survey method, potentially leading to overfitting and an unbalanced representation of the region’s archaeological landscape.
Implications and Future Research Directions
The results underscore the importance of addressing both methodological and data-related biases in archaeological modeling. For example, the distance to water feature consistently influenced model outcomes, possibly reflecting both a genuine historical pattern and a bias in data collection methods. Further refinement of the dataset e.g. site density resampling and the inclusion of more diverse environmental layers may lead to the mitigation of these issues.
The study’s insights are valuable for refining predictive models in archaeology, ensuring they can better account for biases and provide more accurate site predictions. As part of an ongoing project, the findings will contribute to a more comprehensive geoscientific survey of the region, scheduled for publication later this year.
This research not only advances our understanding of bias related to ancient human settlement patterns in Kurdistan but also enhances the methodological toolkit available to archaeologists worldwide.