Edward Leland

Data Scientist | GIS Specialist | Archaeologist
LinkedIn Profile
Datacamp Certifications/Projects
Selected Presentations
Why Standalone?
Project description: GIS is often constrained to a GUI. While this can provide a quick way to collate complex collections of features, it can become cumbersome when you need to perform the same task rapidly over large repositories of data. In order to solve this, it is possible to develop workflows in standalone Python that use QGIS tools. When used in combination with other processing libraries this gives researchers the ability to run complex analysis over lots of data quickly and efficiently without worrying about the RAM limitations inherent to the QGIS GUI. Additionally QGIS is a great set of tools but it falls prey to processes getting stuck in infinite hanging loops due to different plugins not communicating well with each other. This frequenctly occurs when using any form of batch processing in the QGIS GUI. Another fun extention of the Python standalone model is that this system can be run within a Jupyter Notebook allowing for analysts to seamlessly combine .md style documentation with their code. This provides an accessible document useful for sharing with other researchers or for teaching those unfamiliar with your workflow.
Example: Geomorphons
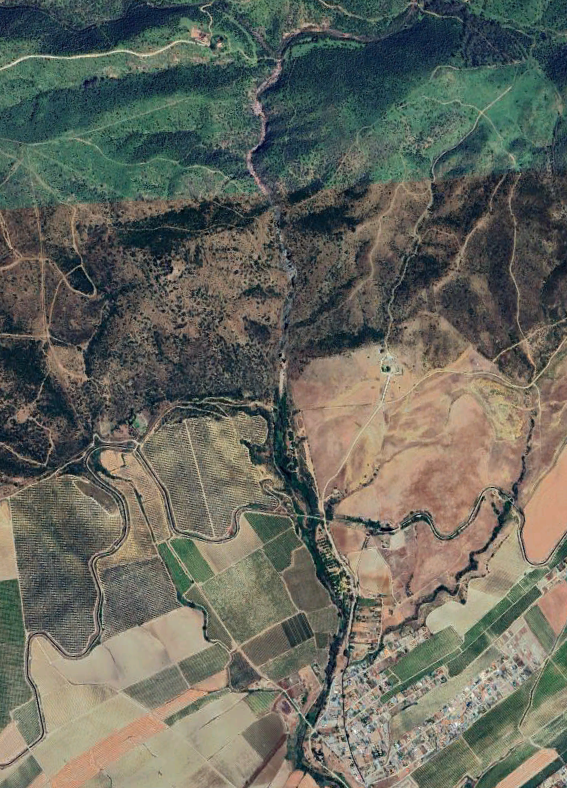
In recent years, geophysicists have constructed algorithms for processing digital elevation maps in order to categorize their features into the 10 most common geomorphometric features. QGIS offers an exceptionally quick version of this via its use of the GRASS r.geomorphon processing method. One easily seen use of this is for the following archaeological application. In the satellite image below, nothing stands out:
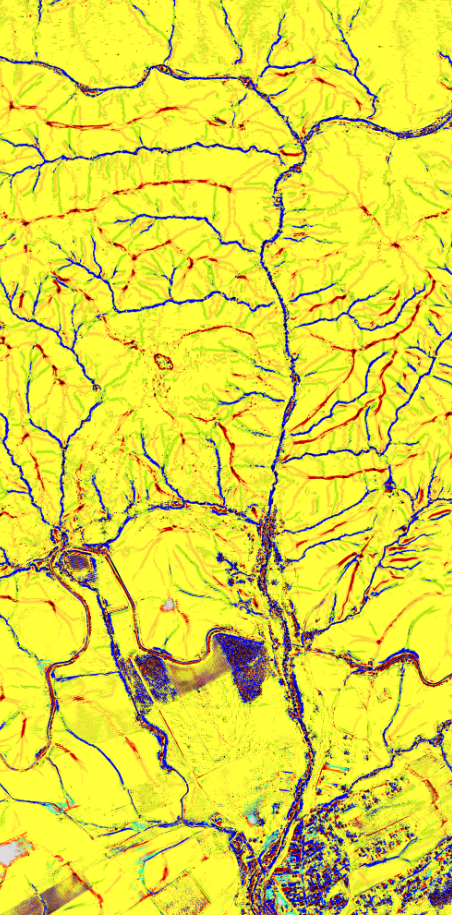
Yet if we use r.geomorphon on a DEM of the area (in this case constructed via processing tiled LIDAR point clouds into one continuous surface) we see an interesting feature arise on the mountain top:
Extracting just the ridge features from the data set gives:
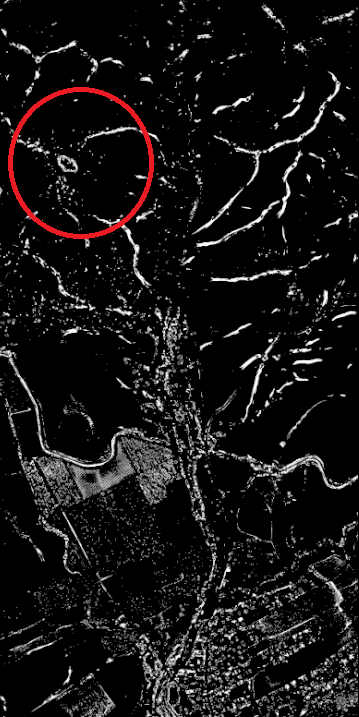
The circular ridge layers highlighted by the red circle define a site of archaeological interest currently under study. This technique could be extended upon by running it over large DEM’s and using a machine learning classifier to extract tiles where similar features are found. This could lead to an extremely quick method to discovering this type of hilltop archaeological site.
Now, when trying to perform this calculation over a series of raster images I kept having to run each image individually as r.geomorphon would get hung up after batch processing sometimes just two raster files. I could have run everything from the command line but I wanted a more elegan solution.
Standalone Code
Getting QGIS to work with an IDE is pretty simple especially if you are looking to run it in a Jupyter notebook:
- Navigate to and click on the OSGeo4W.bat file
- The default location of this is the C:\OSGeo4W directory
- In the OSGeo4W terminal that opens, install Jupyter with the command below:
- python -m pip install jupyter
- In a file explorer window, navigate to the python-qgis-ltr.bat file and copy its path.
- On my machine this was: C:\OSGeo4W\bin\python-qgis-ltr.bat
- Note, if you are not using the long term release (ltr) version of qgis then the .bat file will be named: python-qgis.bat
- In the OSGeo4W terminal, set your working directory to wherever you want to open the Jupyter file explorer.
- Run the command below and you should have a Jupyter window pop up in your default browser:
- C:\OSGeo4W\bin\python-qgis-ltr.bat -m notebook