Edward Leland

Data Scientist | GIS Specialist | Archaeologist
LinkedIn Profile
Datacamp Certifications/Projects
Selected Presentations
Machine Learning with Geographic Data
Project description: Geographic data is usually manipulated via GIS systems e.g. ArcGIS/QGIS. While these technologies provide a relatively user-friendly GUI for visual manipulation of vectors, rasters, and images, analysis is limited to out of the box algorithms and methodologies. By moving GIS data into a pure programming environment we are able to use exponentially more investigatory tools including cutting edge machine learning techniques. Below is a brief overview of one of the studies I’ve conducted using ML for GIS applications.
Presence Only Data and Archaeology
When trying to predict site locations, archaeologists can only rely on presence only data. That is, they know where heritage resources have been discovered but they cannot be 100% sure that at a randomly chosen point within their study area there doesn’t exist an, as of yet, undiscovered archaeological site. This presents a problem for those familiar with machine learning. Common techniques like GLM, Random Forest, XGBoost, etc. require that their input be divided into categories. For example, for simple image classification you might submit a set of pictures of dogs and one of cats for your model to learn the differences between the two. However, we only have one set of data, the points where we know archaeological sites exist.
Enter MaxEnt
Maximum Entropy, or MaxEnt, is a presence only machine learning algorithm commonly used by ecologists to model species dispersion. This technique lends itself well to the problem of archaeological site prediction as both ecologists and archaeologists usually work with datasets that indicate only where their object of study was found. MaxEnt works by first analyzing different environmental variables over the entirety of the study area. From these, it builds a generalized background probability density distribution. MaxEnt then calculates the distribution of environmental variable values at the presence locations. From here MaxEnt iterates, estimating various probability density distributions for the study area. These estimates are constructed with the goal of maximizing their closeness to the generalized distribution while also having similar environmental values in the presence locations.
If this is a bit confusing, I apologize. An in depth explanation of MaxEnt is its own academic article (in fact there are a bunch written on the subject) but a great summary can be found here.
Results
A Maximum Entropy derived occurrence map for probable human habitation sites during the Bronze Age.
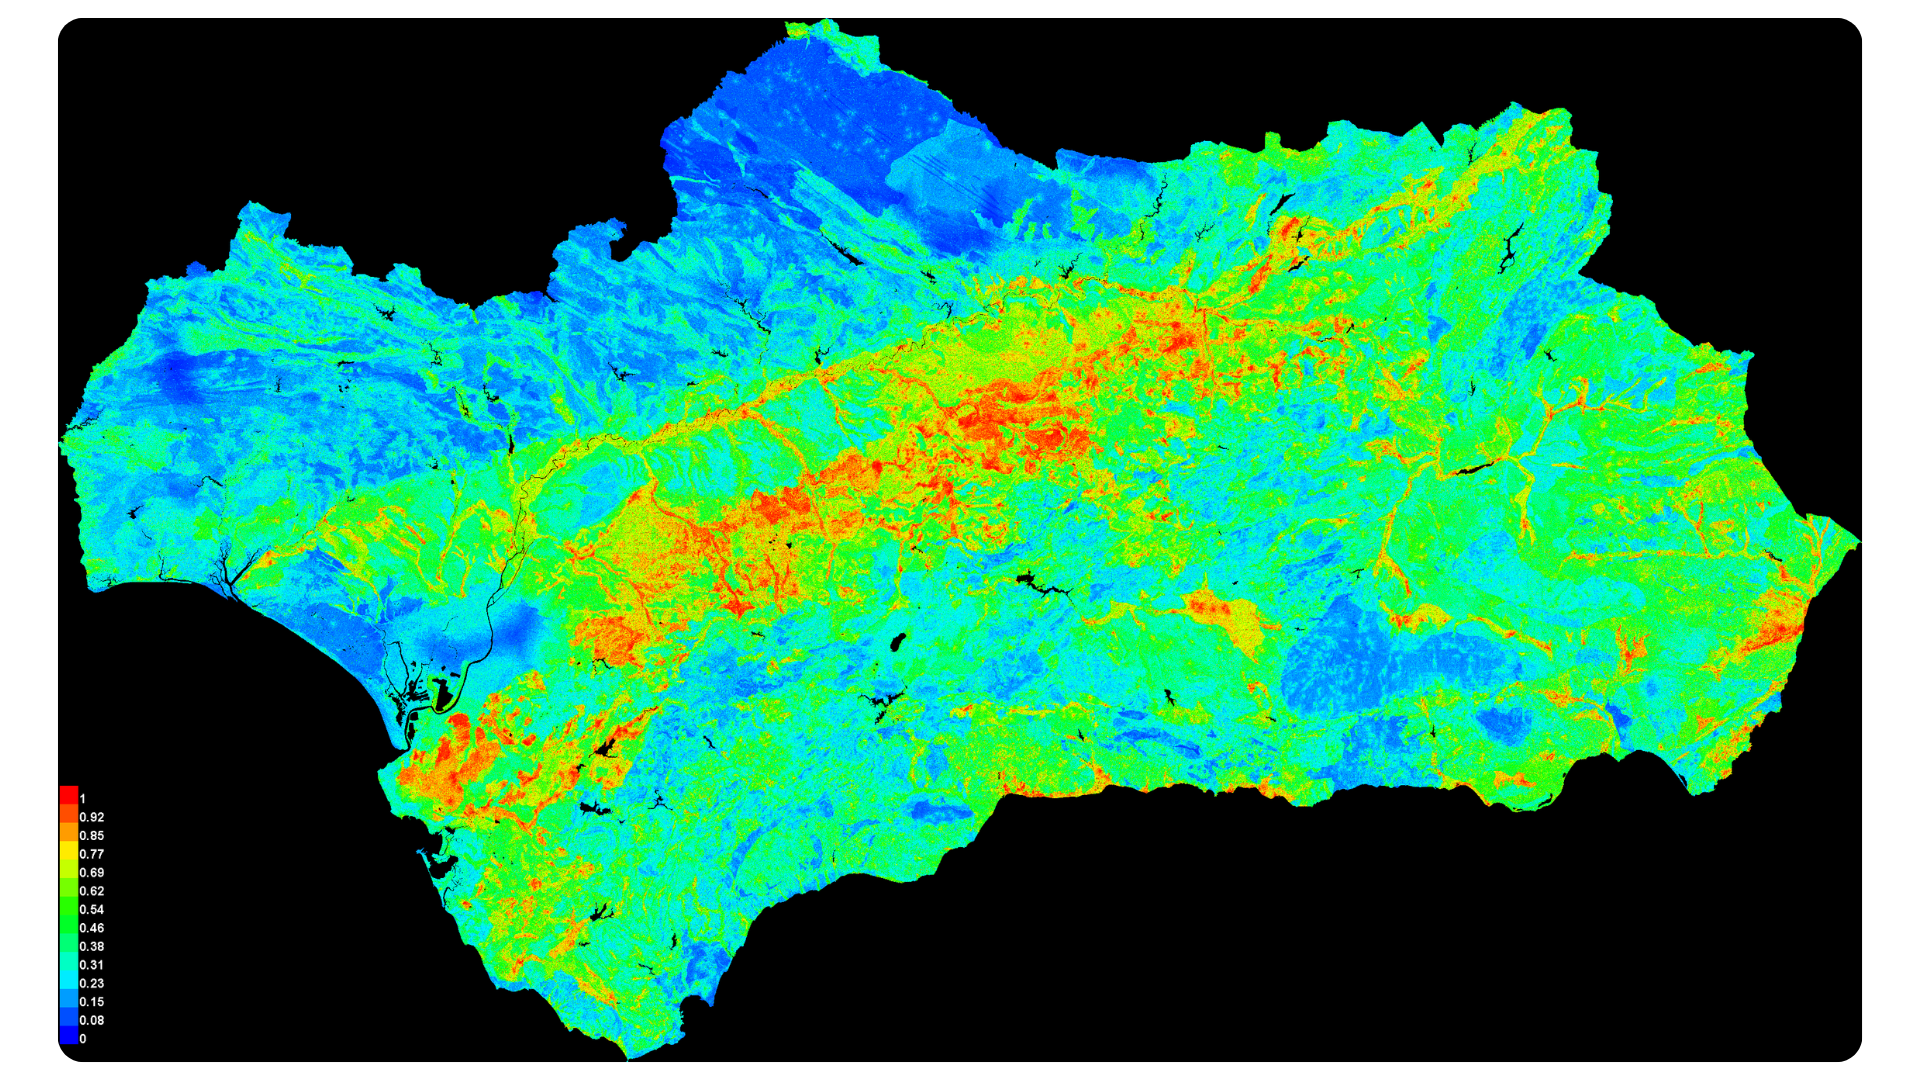
This map shows the most probable areas for human habitation in Red. From this we can draw conclusions about ancient human settlement behavior! There are various other analyses that can help to provide further insight into the past. PCA can help determine what covariates may need to be dropped in order to reduce correlation bias errors. Variable importance within the model itself can help archaeologists understand what environmental factors most affected ancient peoples’ habitation decisions. We even looked into the distribution of habitation patterns across different epochs as well as the distributions by site types e.g. settlement, burial ground, etc. I’d love to go further in depth on what we discovered but this page is already getting a little long for an overview, so feel free to contact me for more details if this piques your interest.